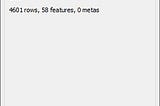
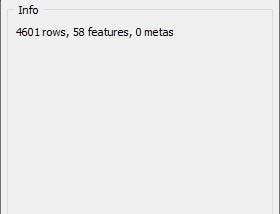
Open in app

Sign In

Write

Sign In

YASH PATEL
YASH PATEL

7 Followers

Home

About

Nov 16, 2021

Practical_Exam_Work

Dataset: https://archive.ics.uci.edu/ml/datasets/Spambase Task-1: Dataset Description using Orange tool. What is need to be done to improve the accuracy of the classification result of the given dataset? Get the maximum classification accuracy possible by performing the following methods. → Pre-processing o Encoding o Normalization o Missing value handling o Feature Selection Task-2: Generate the Dashboard of the preprocessed dataset from task-1. Find the Maximum data insights by plotting Bar chart, Boxplot, Pie Plot, Stack Plot using PowerBI dashboard visualization.

3 min read

Practical_Exam_Work
Practical_Exam_Work

3 min read


Oct 29, 2021

Data Science: Predict the Gender and Age Using OpenCV in Python

Introduction Age and gender prediction are used extensively in the field of computer vision for surveillance. Advancement in computer vision makes this prediction even more practical and open to all. Significant improvements have been made in this research area due to its usefulness in intelligent real-world applications. Application A human face contains…

3 min read

Data Science: Predict the Gender and Age Using OpenCV in Python

3 min read


Oct 28, 2021

Data Science: Exploratory Data Analysis

What is Exploratory Data Analysis? Exploratory Data Analysis (EDA) is the process of gaining a better understanding of data sets by analyzing and visualizing their primary properties. This stage is critical, especially when it comes to classifying the data to apply Machine Learning. Histograms, Box plots, Scatter plots, and other plotting options are available in…

5 min read

Data Science: Exploratory Data Analysis

5 min read


Oct 28, 2021

Data Science: Creating Report using Power BI

Creating Report in Power BI First Create One Blank Workspace. We can Import our dataset or we can use some samples and create a power BI report. Here I used the Cities_Internet_Prices.csv data set. First, we will be creating a visualization that shows the representation of INTERNET PRICE by COUNTRY For making this visualization, we…

2 min read

Data Science: Creating Report using Power BI

2 min read


Oct 28, 2021

Data Science: Generating Dashboard using Power BI

Power BI Dashboard A Power BI dashboard is a single page, often called a canvas, that uses visualizations to tell a story. Because it is limited to one page, a well-designed dashboard contains only the most important elements of that story. The visualizations visible on the dashboard are known as tiles. These tiles…

2 min read

Data Science: Generating Dashboard using Power BI

2 min read


Oct 26, 2021

Data Science: Introduction to PowerBI and Get started with PowerBI, Prepare data for analysis and Model data in Power BI.

What is Power BI? Power BI is software to create & publish reports and data stories from your data sets. You can make highly interactive, engaging, and powerful reports, dashboards, or visuals with Power BI. …

3 min read

Data Science: Introduction to PowerBI and Get started with PowerBI, Prepare data for analysis and…

3 min read


Oct 26, 2021

Data Science: Techniques for Data Reduction in Data Pre-processing

Data reduction is a process that reduced the volume of original data and represents it in a much smaller volume. Data reduction techniques ensure the integrity of data while reducing the data. On the scikit-learn website, many feature selection techniques were provided. …

5 min read

Data Science: Techniques for Data Reduction in Data Pre-processing

5 min read


Oct 5, 2021

Object Detection Using MobileNet SSD

What is Object Detection? Object detection is the process of finding instances of real-world objects such as faces, bicycles, and buildings in images or videos. Object detection algorithms typically use extracted features and learning algorithms to recognize instances of an object category. …

5 min read

Object Detection Using MobileNet SSD

5 min read


Sep 24, 2021

Data Science: Graphical Analysis of data using Neo4j and Gephi Tool

What is graph data? Graph data is known as connected data science, where the relationships and connections are between the data points to make efficient and accurate predictions. How graph data is stored? and how it is represented? Graph data is generally reserved in storage files, where each file contains…

6 min read

Data Science: Graphical Analysis of data using Neo4j and Gephi Tool

6 min read


Sep 17, 2021

Data Science: Data Pre-processing with Orange

Orange is a component-based data mining software. It includes a range of data visualization, exploration, preprocessing, and modeling techniques. It can be used through a nice and intuitive user interface or, for more advanced users, as a module for the Python programming language. Installing Orange 3 library using pip #…

3 min read

Data Science: Data Pre-processing with Orange

3 min read

YASH PATEL

YASH PATEL

7 Followers

Help

Status

Writers

Blog

Careers

Privacy

Terms

About

Text to speech